Welcome to the first article in our MyVitals Case Study series, where we look at different Aged Care Organisations using Provider Assist’s MyVitals software, and how they are using it to take control of their AN-ACC!
While AN-ACC has increased the funding overall coming into Facilities & Organisations, it’s clear from the many voices in the industry that it is still not enough – and it will stabilise. There’s still work to be done to increase AN-ACC funding to be sufficient for the care that’s being delivered. Many people have assumed that, due to the external Assessors, it’s out of their hands and that AN-ACC is a passive funding tool. But AN-ACC is completely the opposite of passive. Let’s look at a Provider using our MyVitals software that has successfully taken control of their AN-ACC funding.
LET’S TAKE A LOOK:
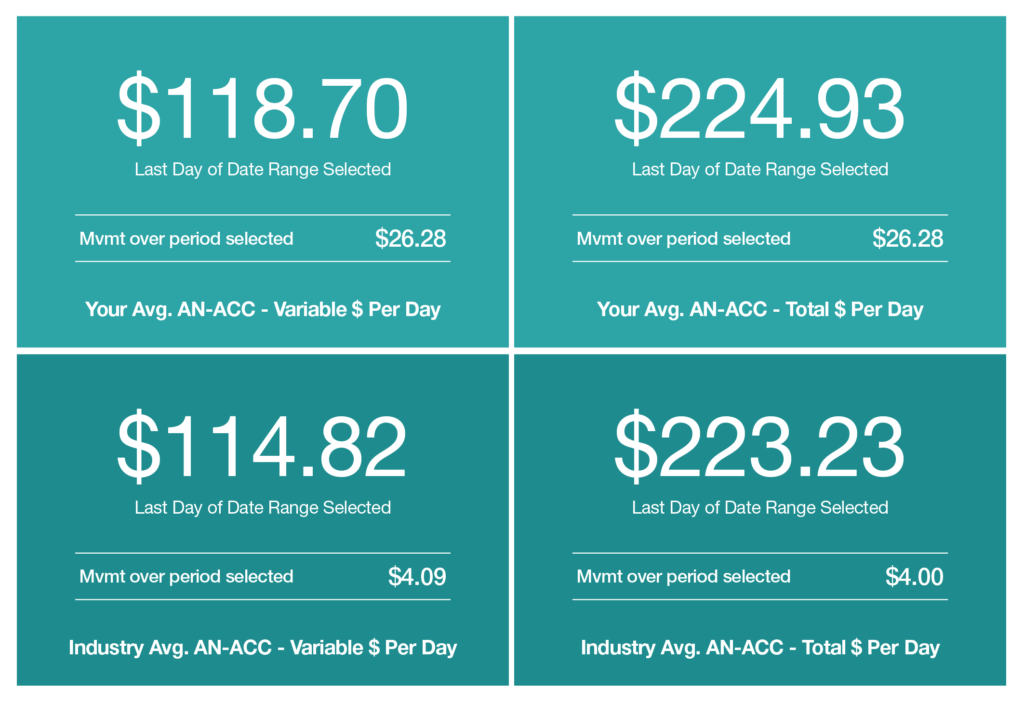
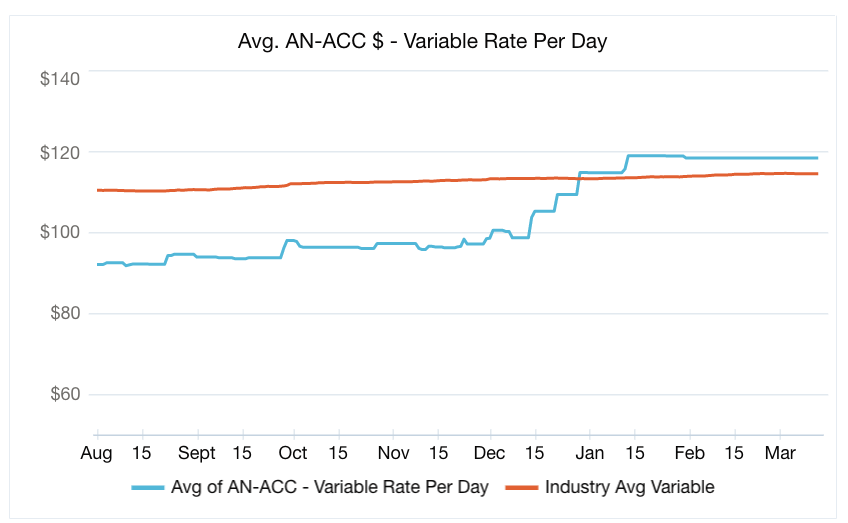
From the beginning of AN-ACC to now (March 2023) – this Provider has successfully increased their AN-ACC Variable Funding $26.28, compared to the industry benchmark of $4.00.
Using MyVitals we can break down how they’ve achieved this by tracking their key indicators.
Average Daily AN-ACC (Source: Provider Assist’s MyVitals Software)
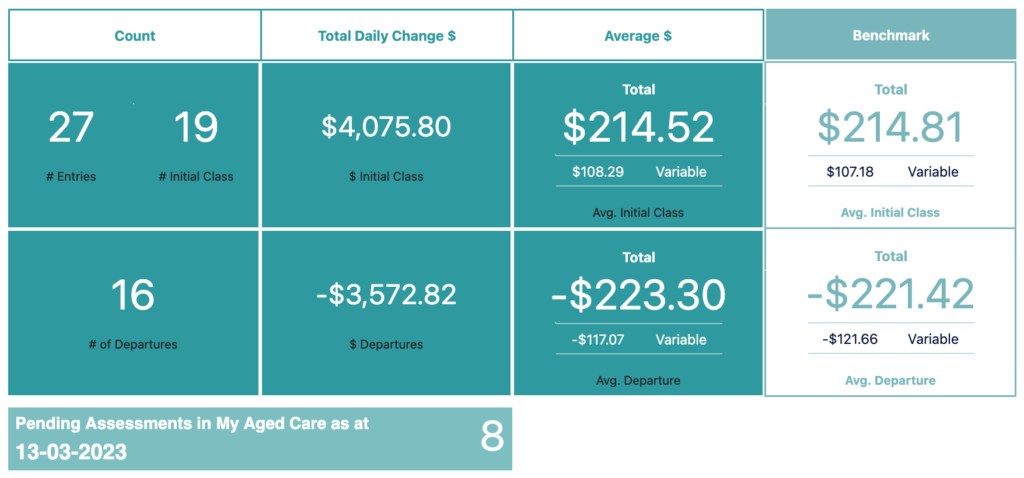
Average Daily Funding (Source: Provider Assist’s MyVitals Software)
HOW HAVE THEY DONE IT?
New Admissions: Over the last 5 months they’ve been focussing on the turnaround, this Provider’s Average New Admit has been $225.23 – almost $10 higher than the industry benchmark we see in MyVitals and almost $30 higher than their starting Average AN-ACC.
They’ve done this by ensuring their assessments, documentation and care delivery support their entitled AN-ACC Funding. We’ve heard of Assessors only reviewing documentation, others only want to interview care staff and not talk to Registered Nurses or Clinical Managers. So, this means you need to be prepared for all approaches!
Departures: Looking at this Provider’s Departures, now at an average of $233.14, higher than the industry average, we can see that considerable and timely reclassification work has been completed.
Reclassification: Finally, the last piece of the puzzle in this success story: Reclassifications. Starting at an average AN-ACC of approximately $18 under the industry average, this Provider knew that this was not representative of their Resident cohorts’ needs, particularly because their Shadow Assessment visit was completed very early in the period and care needs of their Residents had significantly changed by then.
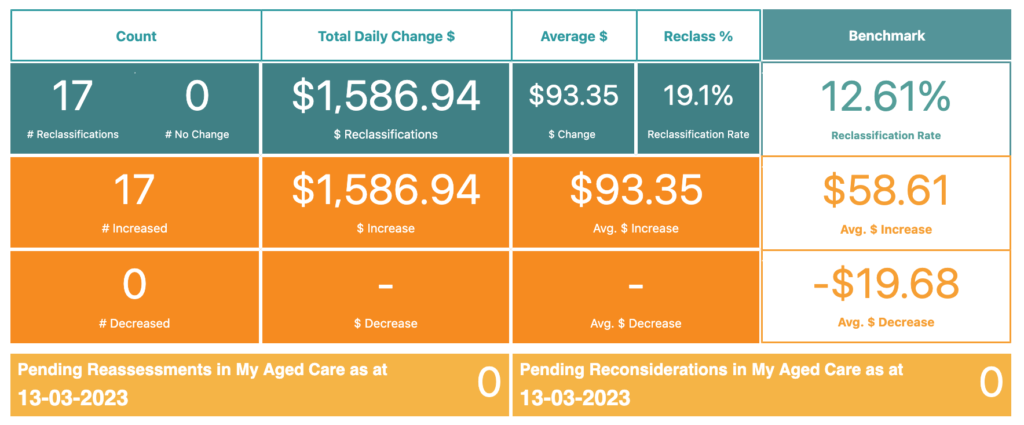
Starting with PA’s free Health Check Analysis, we identified significant amounts of unfunded care being delivered (missed AN-ACC Funding). Developing a workflow plan and working through the identified Residents by following the same approach they used for their New Admissions – ensuring Assessments, care plans and care delivery are all congruent with the Resident’s care needs and supporting the AN-ACC tools – since Reclassifications opened, this Provider has received Reclassifications for 25% of their Residents in care. That is almost 7% higher than the industry average.
Reclassification Statistics – Permanent Care (Source: Provider Assist’s MyVitals Software)
SO, WE CAN SEE…
It’s clear this Provider has done an enormous amount of the right work to get to the position they are in today, and this is reflected in their MyVitals stats.
Understanding that their Shadow Assessments were no longer reflective of their Residents, they have worked hard at staying on top of Reclassifications.
Additionally, for both New Admissions & Reclassifications, the Provider prepared thoroughly for all type of Assessors & ensuring all assessments, care plans and care delivery were all congruent with the Resident’s care needs – resulting in Reclassifications that represented their Residents.
We can see from this Provider that taking control of you’re an-ACC is possible; starting with staying on top of Reclassifications and be prepared for all assessment approaches by ensuring:
Assessment, documentation, care planning and care delivery is rooted in strong, proactive needs-based comprehensive assessment
Your whole clinical picture from assessment to care planning to care delivery is congruent
Your staff deeply understand assessed need and the AN-ACC tools so they can make better and more aligned decisions daily, and articulate that to the Assessors
Residents & families understand their care and it meets their goals and preferences.
THE BEFORE & AFTER
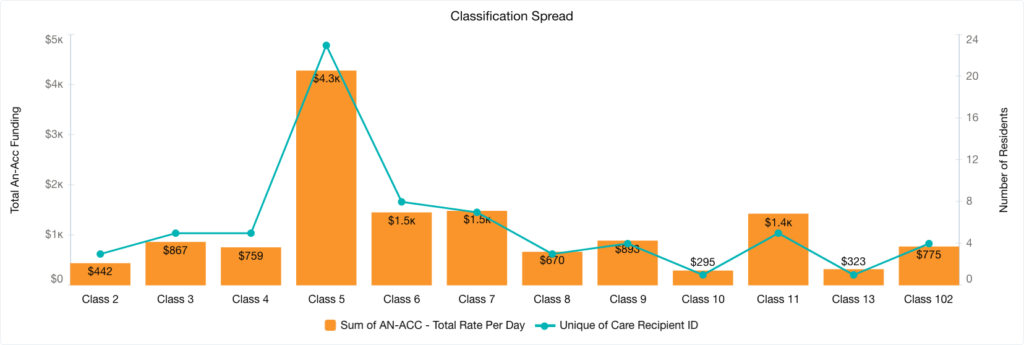
To really highlight the impact of the work that this Provider has put in, let’s take a look at the shift in their Classification distribution mix from August 2022 to now (March 2023):
Before - August 2022 (Source: Provider Assist’s MyVitals Software)
You can see the shift in the Class distribution from the 6 months prior reflected in this graph:
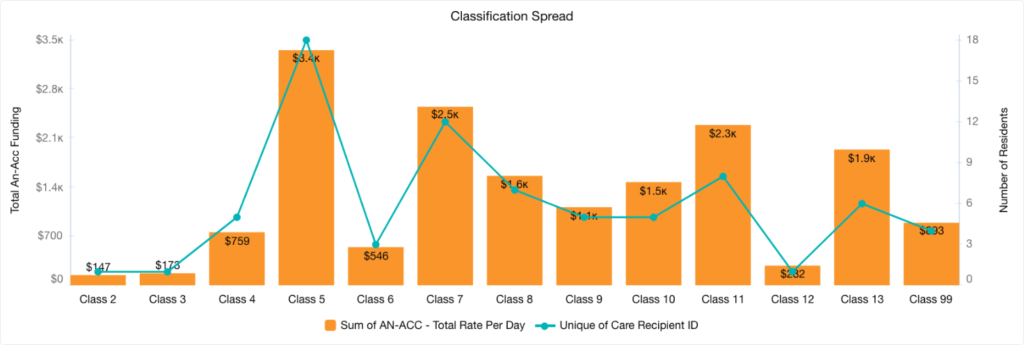
After - March 2023 (Source: Provider Assist’s MyVitals Software)
The shift of the Classification distribution results in this Provider’s Total AN-ACC funding increasing by $3331 a day. This is a great result for the Residents, and ensures that the Provider can provide the appropriate level of care.
Want to see graphs like this for your Organisation too?
Get in touch with us to find out more about our MyVitals software for AN-ACC!